Robot@Home dataset
The Robot-at-Home dataset (Robot@Home, paper here) is a collection of raw and processed data from five domestic settings compiled by a mobile robot equipped with 4 RGB-D cameras and a 2D laser scanner. Its main purpose is to serve as a testbed for semantic mapping algorithms through the categorization of objects and/or rooms.
New! Join the Robot@Home community in GitHub! Share your experience, exchange information, and more!

If you use this dataset, please cite it through:
      @ARTICLE{Ruiz-Sarmiento-IJRR-2017,
           author = {Ruiz-Sarmiento, J. R. and Galindo, Cipriano and Gonz{\'{a}}lez-Jim{\'{e}}nez, Javier},
            title = {Robot@Home, a Robotic Dataset for Semantic Mapping of Home Environments},
          journal = {International Journal of Robotics Research},
             year = {2017}
      }
Organizations using Robot@Home:


1. Summary
Novelty of the Robot@Home dataset
This dataset is unique in three aspects:
- The provided data were captured with a rig of 4 RGB-D sensors with an overall field of view of 180°H. and 58°V., and with a 2D laser scanner.
- It comprises diverse and numerous data: sequences of RGB-D images and laser scans from the rooms of five apartments (87,000+ observations were collected), topological information about the connectivity of these rooms, and 3D reconstructions and 2D geometric maps of the visited rooms.
- The provided ground truth is dense, including per-point annotations of the categories of the objects and rooms appearing in the reconstructed scenarios, and per-pixel annotations of each RGB-D image within the recorded sequences
During the data collection, a total of 36 rooms were completely inspected, so the dataset is rich in contextual information of objects and rooms. This is a valuable feature, missing in most of the state-of-the-art datasets, which can be exploited by, for instance, semantic mapping systems that leverage relationships like \emph{pillows are usually on beds} or \emph{ovens are not in bathrooms}. Robot@Home is accompanied with a specific software to conveniently access and manage the data, namely the Object Labeling Toolkit (OLT).
The following video shows the RGB images captured by the 4 RGB-D devices at one of the inspected apartments:
Ground-truth information
The ground-truth information provided by the dataset comes in two flavors. On the one hand, we provide (per-point) annotations of the categories of the main objects and rooms appearing in the reconstructed scenes. A total of ~1,900 objects belonging to 157 different categories were manually labelled from the 36 visited rooms (some of them several times). These rooms are also labelled as one of 8 possible categories. On the other hand, Robot@Home includes (per-pixel) annotations of the objects appearing in the 69,000+ gathered RGB-D images. The objects and rooms are also annotated with identifiers, so they can be individually tracked along the video sequences.
Dataset applications
Robot@Home is specially suitable for robotic algorithms performing semantic mapping through the categorization of objects and/or rooms. It can be also useful for the recognition of instances of objects/rooms, object segmentation, or data compression/transmission algorithms. Moreover, typical robotic tasks like 3D map building, localization, or SLAM can be tested with Robot@Home, since the robot localization can be accurately estimated from the sequence of 2D scans. Finally, a number of distinctive patterns and objects has been placed on purpose in the scenarios so the dataset can be used to test object-finding algorithms.
Avaiable data
The data are provided in both, different formats accessible by the open source Mobile Robot Programming Toolkit (MRPT), and (human readable) plain text files and png images. The dataset includes:
- 81 sequences of observations containing ~75min. of recorded data. The total number of observations is 87,000+ (18,000+ laser scans and 69,000+ RGB-D images), which are saved in [rawlog,plain_text+images] format.
- 72 3D reconstructed scenes in [scene,plain_text] format.
- 41 2D geometric maps saved in plain text files (36 for individual rooms, and 5 maps covering each apartment).
- 72 Labelled 3D reconstructed scenes in [scene,plain_text] format, containing ~1,900 labelled objects.
- 72 Labelled RGB-D sequences in [rawlog,plain_text+images] format.
Intended users
Robot@Home aims to be a testbed for researchers working on semantic mapping through object/room categorization, object/room recognition, 2D/3D mapping, 2D/3D localization, object segmentation, etc.
Webpage structure
The Downloads section lists the different download options for getting the dataset, which has been conveniently divided for users with different interests. The Dataset usage section shows how to handle the data provided within the dataset. Finally, the Additional information section provides extra resources.
2. Downloads
The information contained in the dataset is available divided into sessions and types, so the users can get chunks of information depending on their needs. Each downloable unit is available in both, files with formats accessible by MRPT and OLT (rawlog or scene files) represented with the F icon, and human readable files (plain text files or PNG images) represented by the P icon. More information about these data types can be found here. Formated files are compressed in .rar, and human readable ones in .7z.
| Sessions/Data | Raw data [+info] | Laser scans [+info] | RGB-D data [+info] | Reconstructed scenes [+info] | Labeled scenes [+info] | Labeled RGB-D data [+info] |
| alma-s1 | F P | F P | F P | F P | F P | F P |
| anto-s1 | F P | F P | F P | F P | F P | F P |
| pare-s1 | F P | F P | F P | F P | F P | F P |
| rx2-s1 | F P | F P | F P | F P | F P | F P |
| sarmis-s1 | F P | F P | F P | F P | F P | F P |
| sarmis-s2 | F P | F P | F P | F P | F P | F P |
| sarmis-s3 | F P | F P | F P | F P | F P | F P |
| All | F P | F P | F P | F P | F P | F P |
Data formats
Data are provided in two flavors:
- Formated files, accesible by MRPT and OLT, represented with F. Concretely:
- Human readable files, represented with P. They are grouped into:
- plain text files: different types of (numerical) information are stored in these files, including information about the observations within a sequence, 2D laser scans, reconstructed scenes, labelled reconstructed scenes, and labeled RGB-D images. The content of these files is explained at the files headers. For example, this is the header of a 2D laser scan:
# This file contains a 2D laser scan observation.
# Its format is:
# [aperture] [max_range] [number_of_scans]
# [vector_of_scans]
# [vector_of_valid_scans]
# The aperture of the sensor is in radians, the maximum range
# and measurements are in meters. '1' means a valid scan, '0' otherwise.- PNG images: images are stored in files with the PNG format. There are two types of images:
- RGB images: Stored as three channels (R,G, and B) of uint8_t numbers.
- Depth images: Stored as one channel of uint16_t numbers. Depth information (in meters) is encoded in the following way:
- PNG images: images are stored in files with the PNG format. There are two types of images:
depth_i = value_of_pixel_i*(1/6,553.5);In oder to retrieve the 3D coordinates of a point/pixel, you can use the following equations (see next section for cameras’ calibration parameters):
x(i) = depth_i;
y(i) = (cx - c) * x(i) / fx
z(i) = (cy - r) * x(i) / fy
Calibration parameters
Intrinsic calibration parameters for the 4 RGBD cameras (they provide 320×240 resolution images):
- cx = 157,3245865
- cy = 120,0802295
- fx = 286.441384
- fy = 271.36999
Extrinsic calibration parameters for the sensors placed on the robot, i.e., they rigid transformation w.r.t. the robot’s frame. Please notice that, since the dataset was mainly collected in two different periods, the ids of the RGBD sensors can change depending on the sequence. The right ones are specified below. In such parameters, x points towards, y to the left and z upwards (distances are in meters and angles in degrees), that is:
sensor: HOKUYO1 (for all sequences)
- pose_x = 0.205
- pose_y = 0
- pose_z = 0.31
- pose_yaw = 0
- pose_pitch = 0
- pose_roll = 0
sensor: RGBD_1 (in sarmis sequences) RGBD_4 (in the remaining ones)
- pose_x = 0.285
- pose_y = 0
- pose_z = 1.045
- pose_yaw = 0
- pose_pitch = 0
- pose_roll = 90
sensor: RGBD_2 (in sarmis sequences) RGBD_1 (in the remaining ones)
- pose_x = 0.271
- pose_y = -0.031
- pose_z = 1.045
- pose_yaw = -45
- pose_pitch = 0
- pose_roll = 90
sensor: RGBD_3 (in all scenes)
- pose_x = 0.271
- pose_y = 0.031
- pose_z = 1.045
- pose_yaw = 45
- pose_pitch = 0
- pose_roll = 90
sensor: RGBD_4 (in sarmis sequences) RGBD_2 (in the remaining ones)
- pose_x = 0.24
- pose_y = -0.045
- pose_z = 1.045
- pose_yaw = -90
- pose_pitch = 0
- pose_roll = 90
Raw data
F P alma-s1
F P anto-s1
F P pare-s1
F P rx2-s1
F P sarmis-s1
F P sarmis-s2
F P sarmis-s3
F P all
The raw data contains all the data collected in the seven sessions. Each session consists of a number of sequences of observations partially or totally inspecting a house. The gathered observations can be of two types: laser scans, or RGB-D observations. The formated sequences are provided in the Rawlog common robotics dataset format, and are raw in the sense that neither extrinsic nor intrinsic calibrations are applied to the observations.
Laser scans
F P alma-s1
F P anto-s1
F P pare-s1
F P rx2-s1
F P sarmis-s1
F P sarmis-s2
F P sarmis-s3
F P all
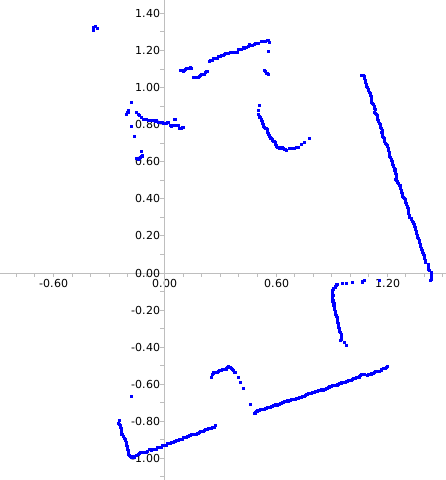
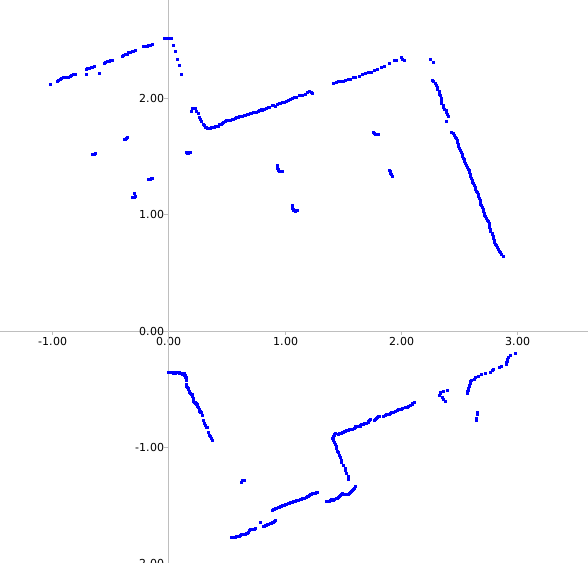
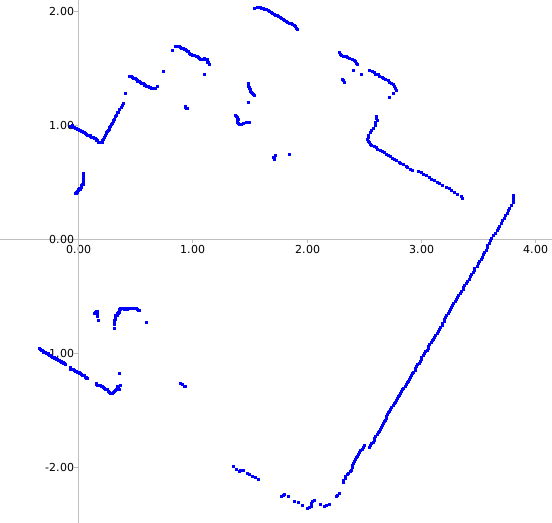
The laser scanner data contains the information gathered from the URG-04LX-UG01 device mounted on the robot. They are available the laser scans per session, which in turn are divided into sequences inspecting the different rooms. These are some examples of laser scans from (left to right) a bathroom, a living room, and a bedroom.
RGB-D data
F P alma-s1
F P anto-s1
F P pare-s1
F P rx2-s1
F P sarmis-s1
F P sarmis-s2
F P sarmis-s3
F P all
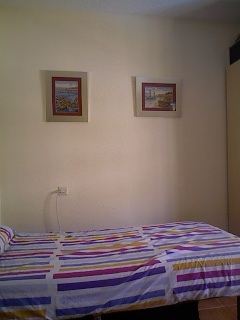
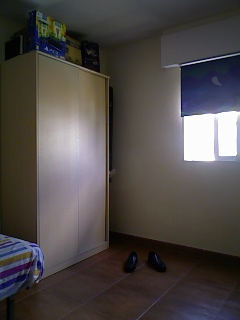
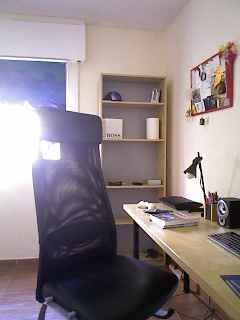
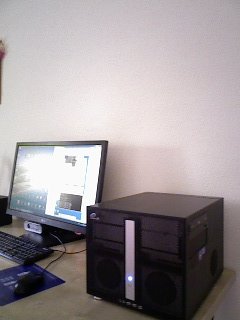
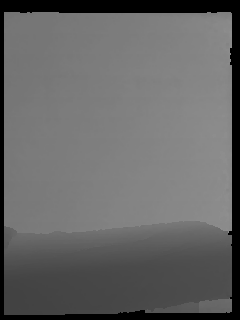
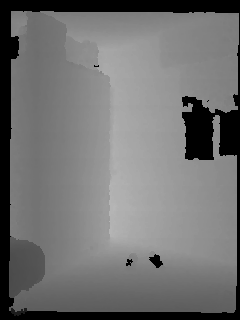
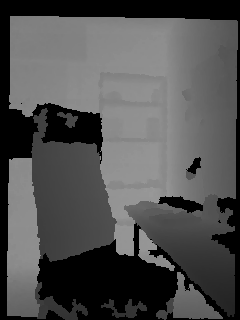
The RGB-D data entails the observations gathered by the four RGB-D devices. They are available the RGB-D observations per session, which in turn are divided into sequences inspecting the different rooms. A RGB-D observation comprises a RGB (intensity) image, a depth image, and a colored point cloud. Below they are shown the RGB and depth images captured by each of the RGB-D devices in a bedroom.
Geometric maps
P 2D geometric maps
P 2D geometric maps + logs
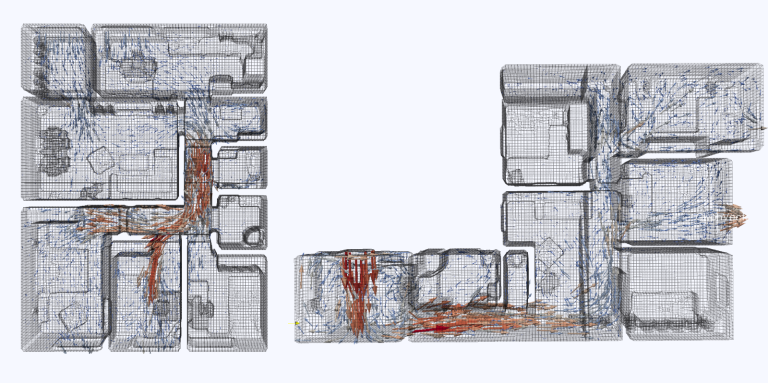
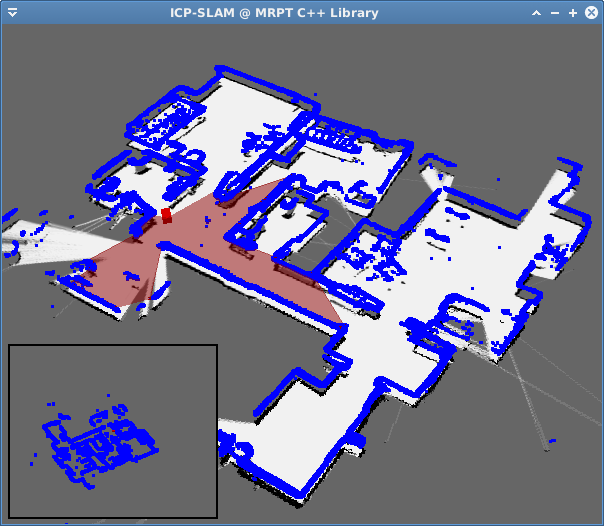
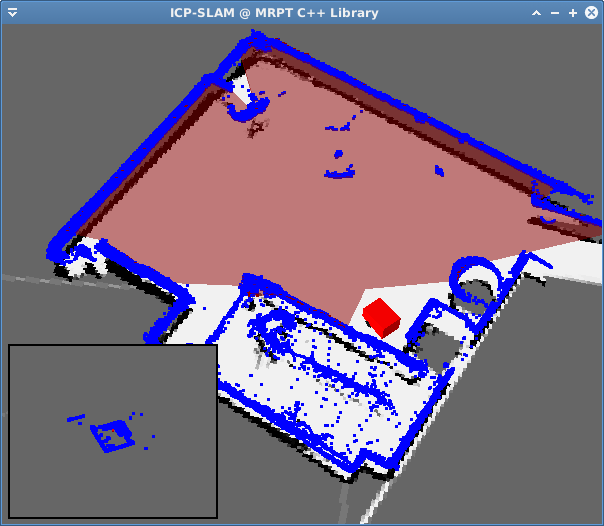
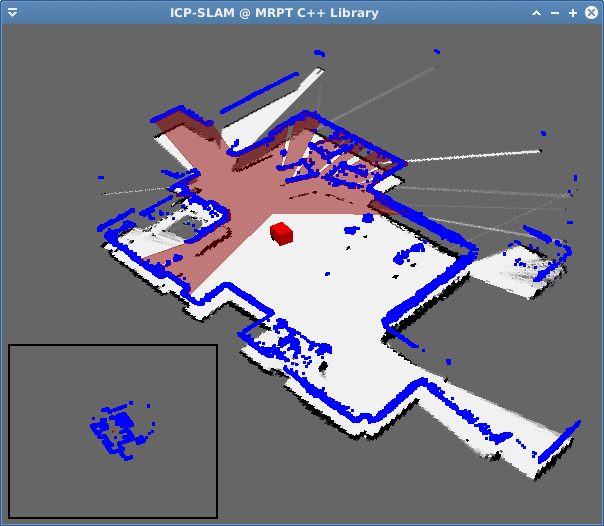
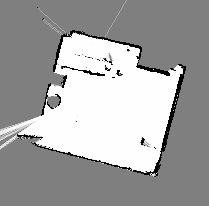
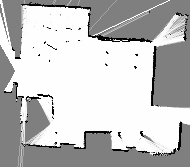
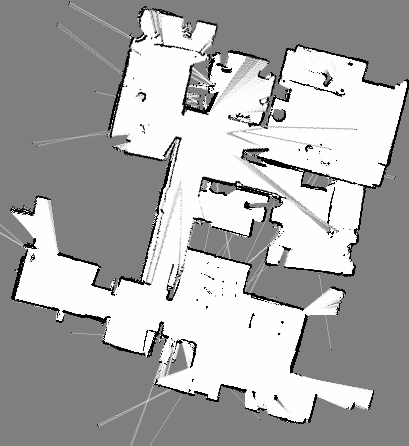
They have been built a 2D geometric map for each room within the 5 inspected apartments, including five more of the full house. For that, we have resorted to the icp-slam application from MRPT. Next images are: (top row) examples of 2D geometric maps during their building (from left to right: a bedroom, the living room, and the full house), and (bottom row) the resultant maps.

Reconstructed scenes
F P alma-s1
F P anto-s1
F P pare-s1
F P rx2-s1
F P sarmis-s1
F P sarmis-s2
F P sarmis-s3
F P all
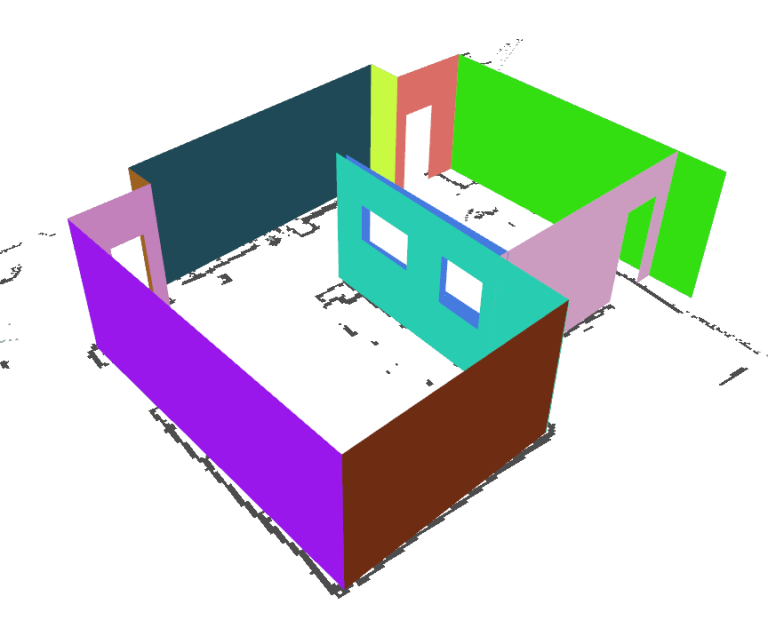
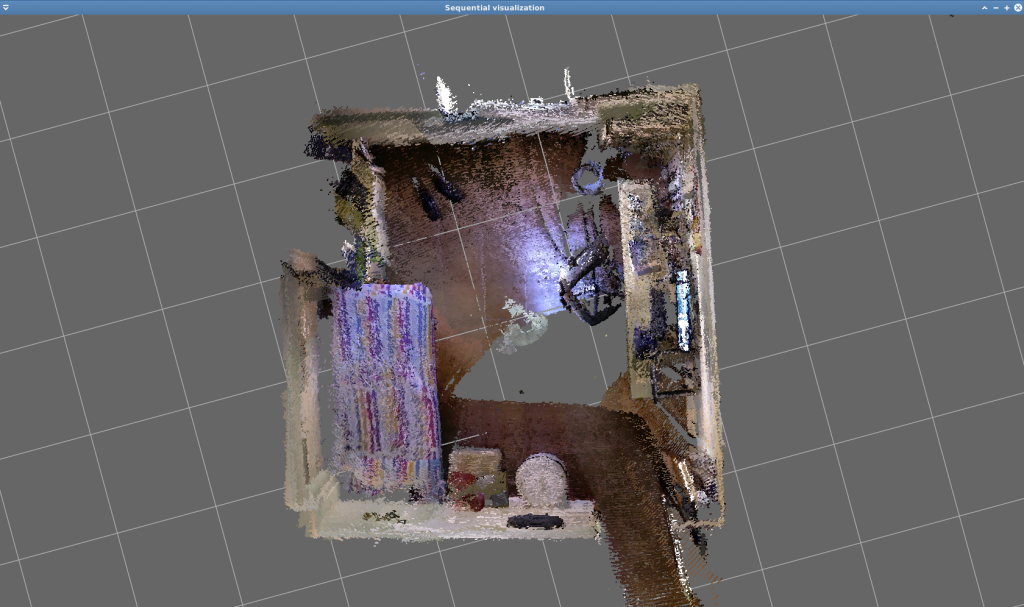
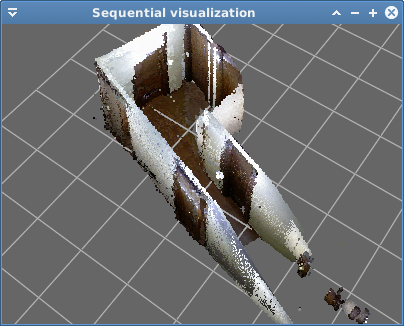
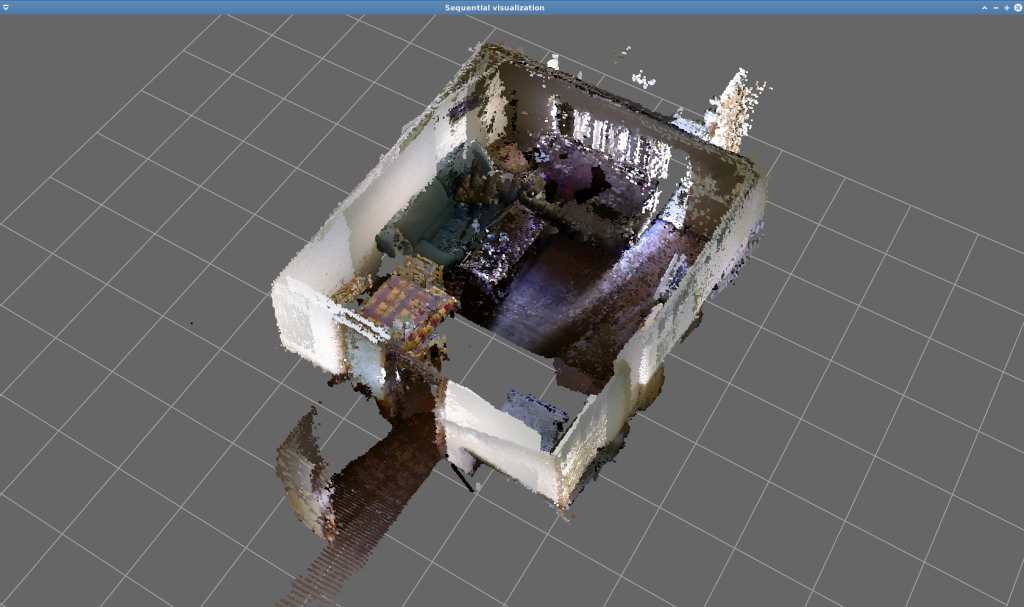
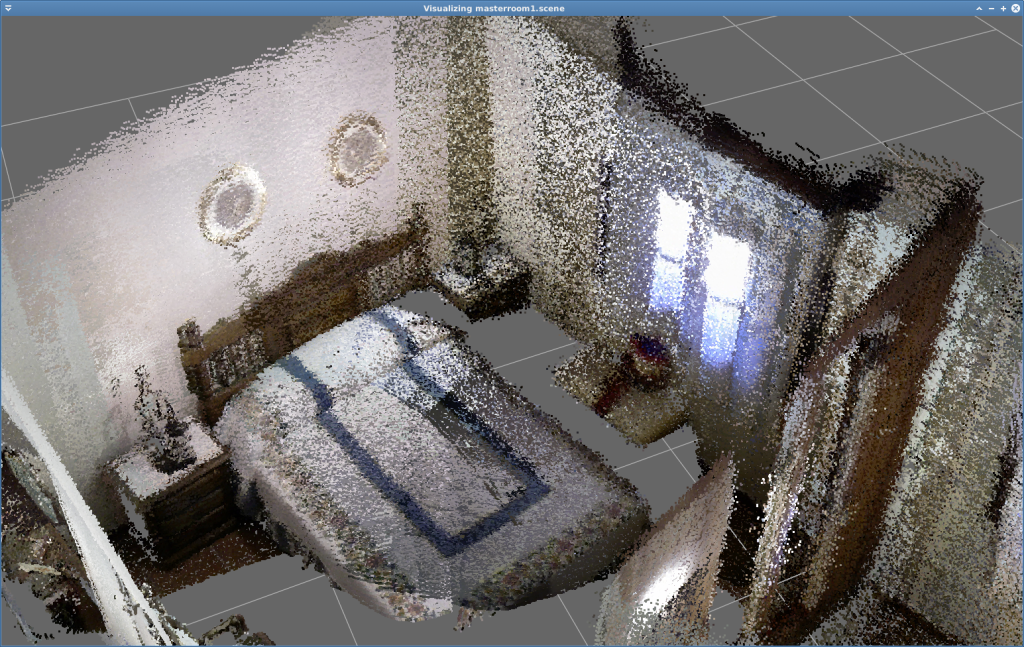
For each sequence inspecting a room, its 3D coloured point cloud reconstruction is available. Such reconstruction is built employing the Mapping application within the Object Labeling Toolkit (OLT), which registers the RGB-D observations employing different ICP-based techniques. The following images show reconstructed examples of (from left to right) a bedroom, a corridor, and a livingroom.
Labeled scenes
F P alma-s1
F P anto-s1
F P pare-s1
F P rx2-s1
F P sarmis-s1
F P sarmis-s2
F P sarmis-s3
F P all
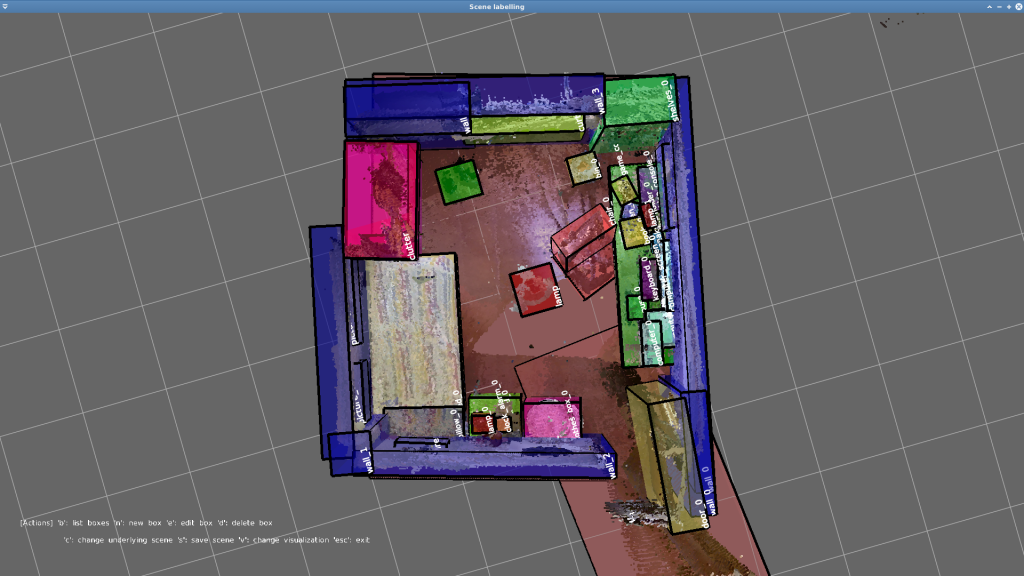
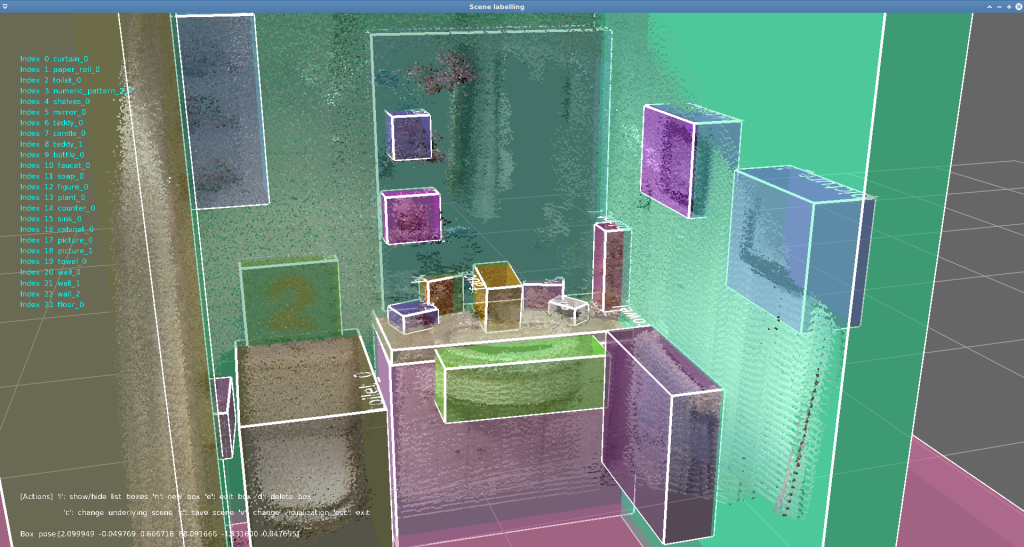
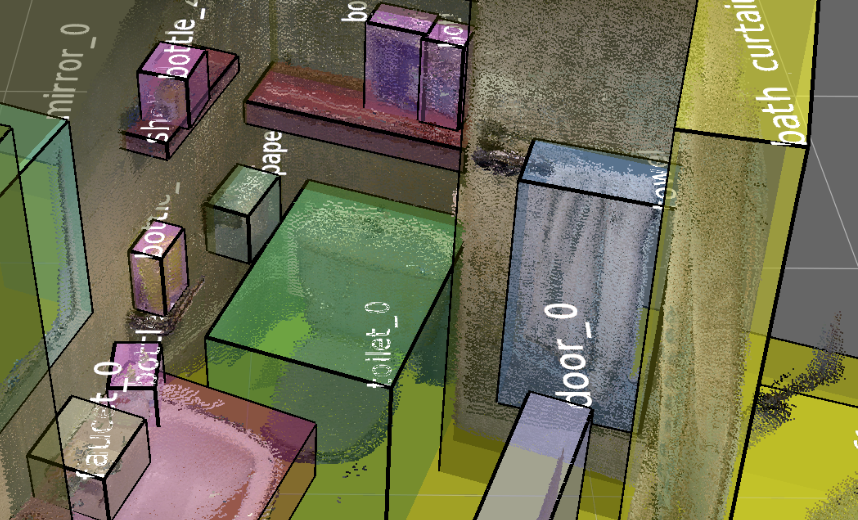
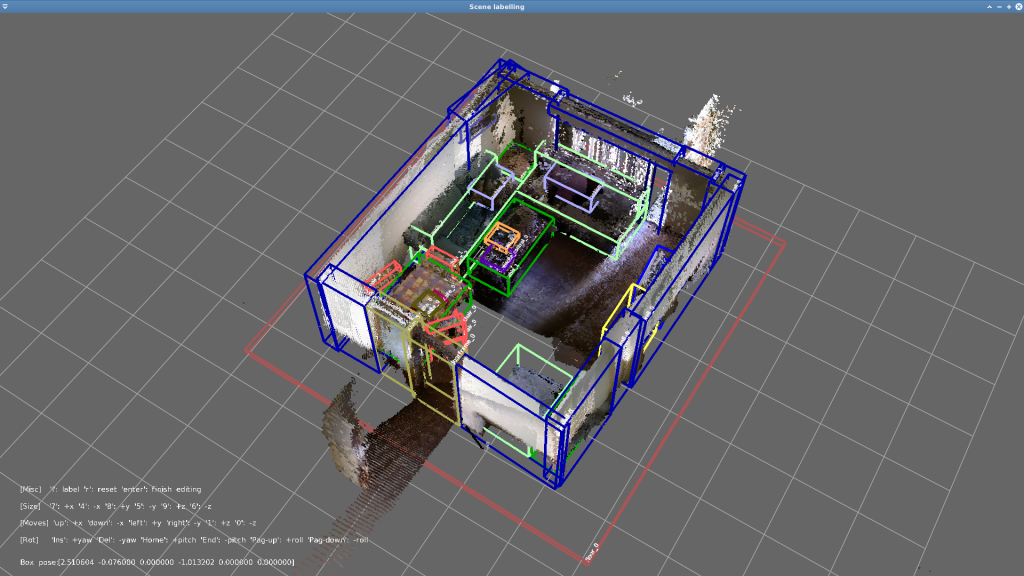
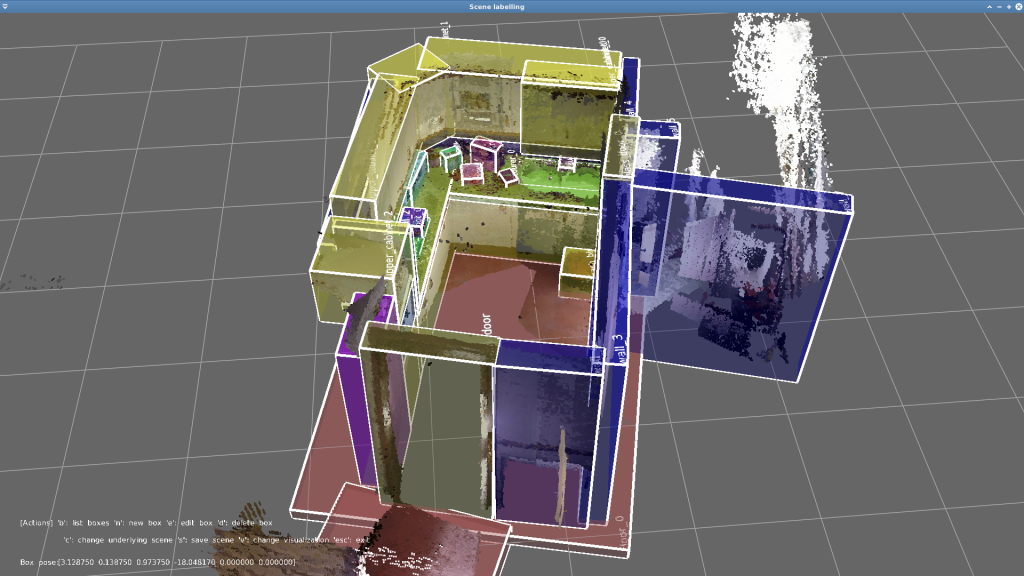
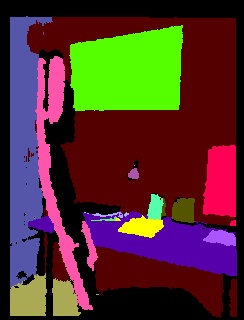
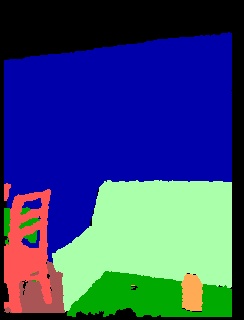
They are available the annotations made over the reconstructed places. These labeled were annotated employing the Label scene application within OLT, and can be downloaded as .scene files. Next, some figures of labeled places are shown:

Labeled RGB-D data
F P alma-s1
F P anto-s1
F P pare-s1
F P rx2-s1
F P sarmis-s1
F P sarmis-s2
F P sarmis-s3
F P all
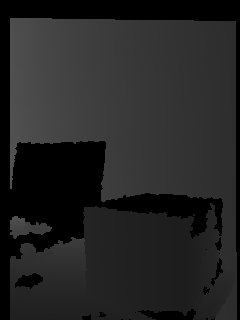
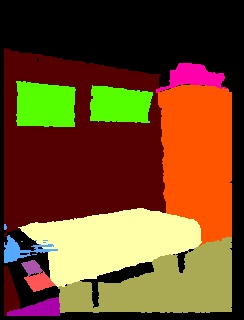
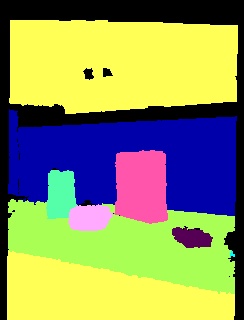
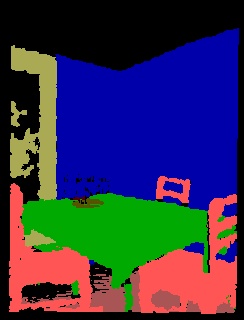
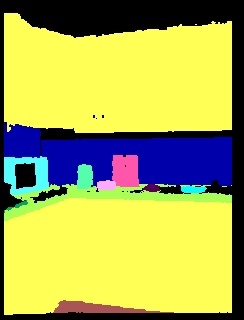
These files contains the labeled RGB-D observations within the different sequences. To label them we again employ OLT, and propagate the objects’ annotations into the labeled places to the intensity image, depth image, and point cloud of each RGB-D observation. The figures below are examples of automatically labeled depth images.
3. Dataset usage
This section shows how to manipulate the provided data in different ways. If you find someone missing, please let us know and we will add it. Enjoy!
The data provided in the dataset can be easily accessed employing MRPT, since their datatypes come from it. Moreover, OLT provides additional features to manage them.
Visualize a reconstructed scene
With MRPT
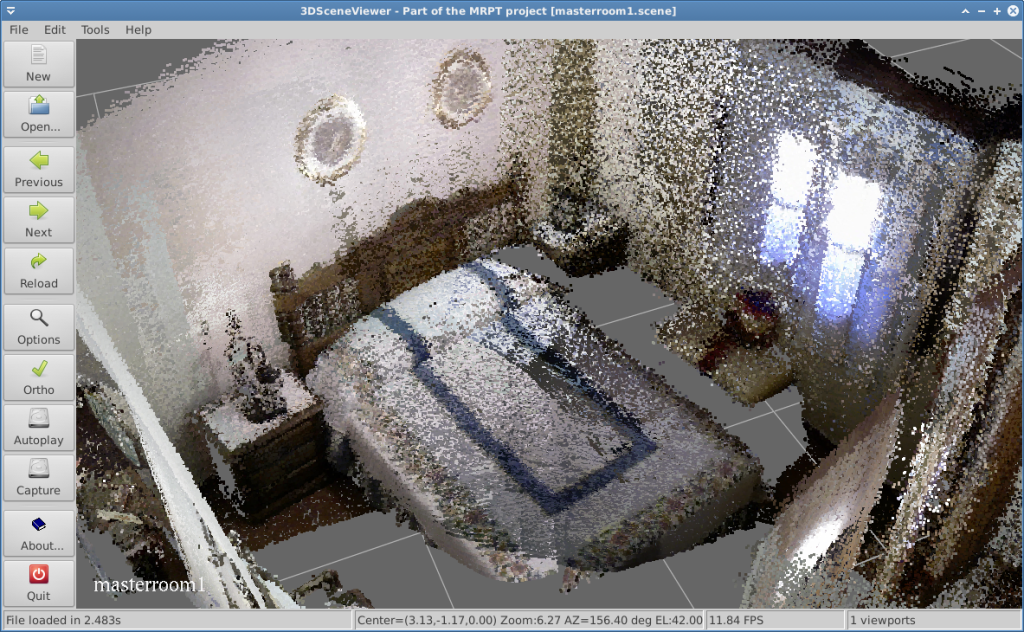
The MRPT library comes with the SceneViewer3D application, with permits us to load and visualize a 3D scene in general, and a a reconstructed scene in particular. This application has different visualization options that can be interesting for inspecting the scenes or taking snapshots of them.
With OLT
With OLT you have two applications to visualize a reconstructed scene:
- The Visualize_reconstruction application, with $Visualize_reconstruction <scene file>
- The Label_scene application, with $Label_scene <configuration file>, and specifying in the configuration file the scene file to be loaded.
Visualize a labelled reconstructed scene
Coming soon!
4. Additional information
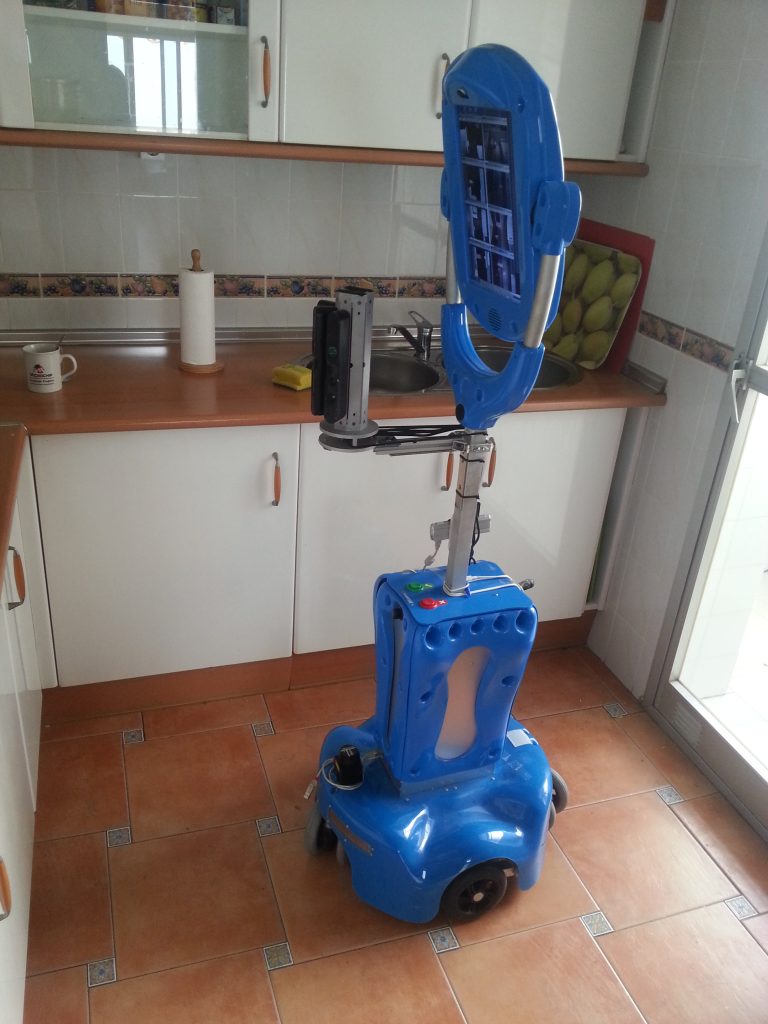
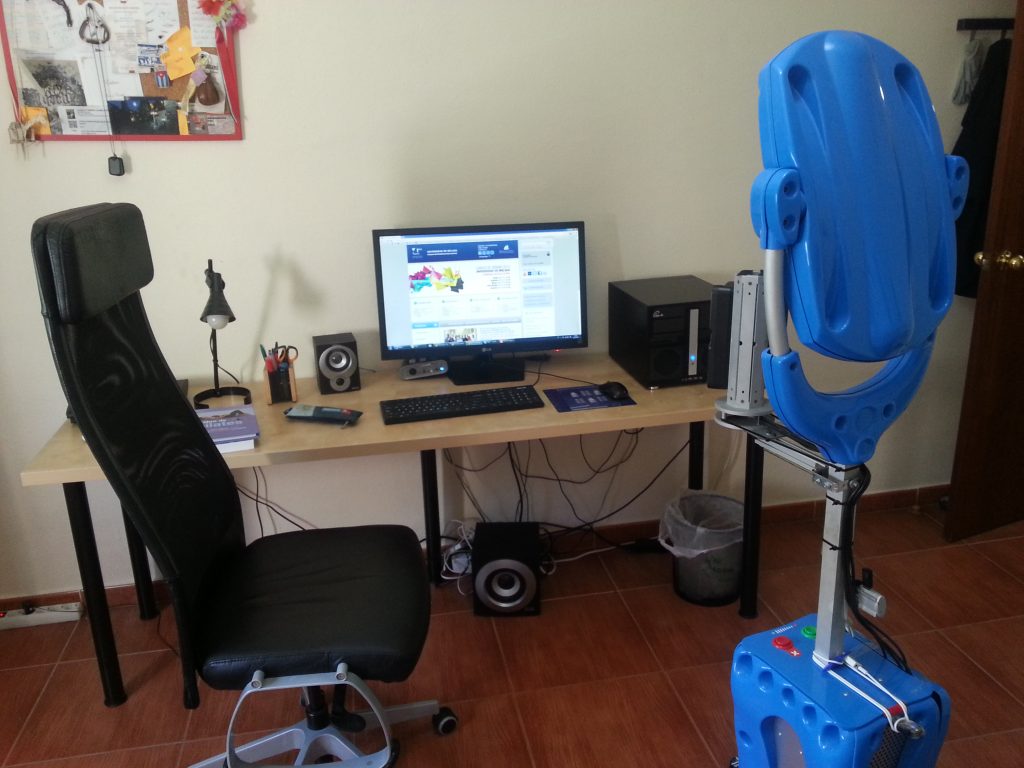
Next, they are shown some pictures of the robot while it was gathering the dataset. In them we can see the 4 RGB-D rig mounted on the robot’s neck, and the laser scan placed just on its base.

Change log
- [2016-April] All the data is also available in (human readable) plain text files or PNG images.
- [2016-March] All the raw and processed data of the seven sessions are available at the webpage.
- [2016-January] Performed data collection at alma house.
- [2016-January] Inspected anto house.
- [2016-January] Recorded session at pare house.
- [2016-January] Inspected rx2 house.
- [2015-May] Dataset’s webpage created.
- [2014-July] Collected three sessions at sarmis house.
- [2014-July] Started the collection of the dataset.